alexander
Every year the tool landscape shifts. Some tools fade away. Others become indispensable. If you manage a team or write code daily, you already know that the wrong tool can cost you hours of context switching. The right tool can save your entire week.
For 2026, the bar is higher. We are seeing a convergence of AI assisted coding, deeper observability, and automation that actually works. This guide breaks down the five essential developer tools 2026 that will change how you ship software. No fluff. Just the tools that will make your daily work smoother, your deployments safer, and your team happier.
The five essential developer tools 2026 are AI pair programmers, unified observability platforms, next-gen container orchestration dashboards, automated code review bots, and local development environments that mirror production. Each tool targets a specific bottleneck in your workflow. Adopting even two of them can cut your cycle time by half and reduce debugging hours significantly.
The AI Pair Programmer That Actually Understands Your Codebase
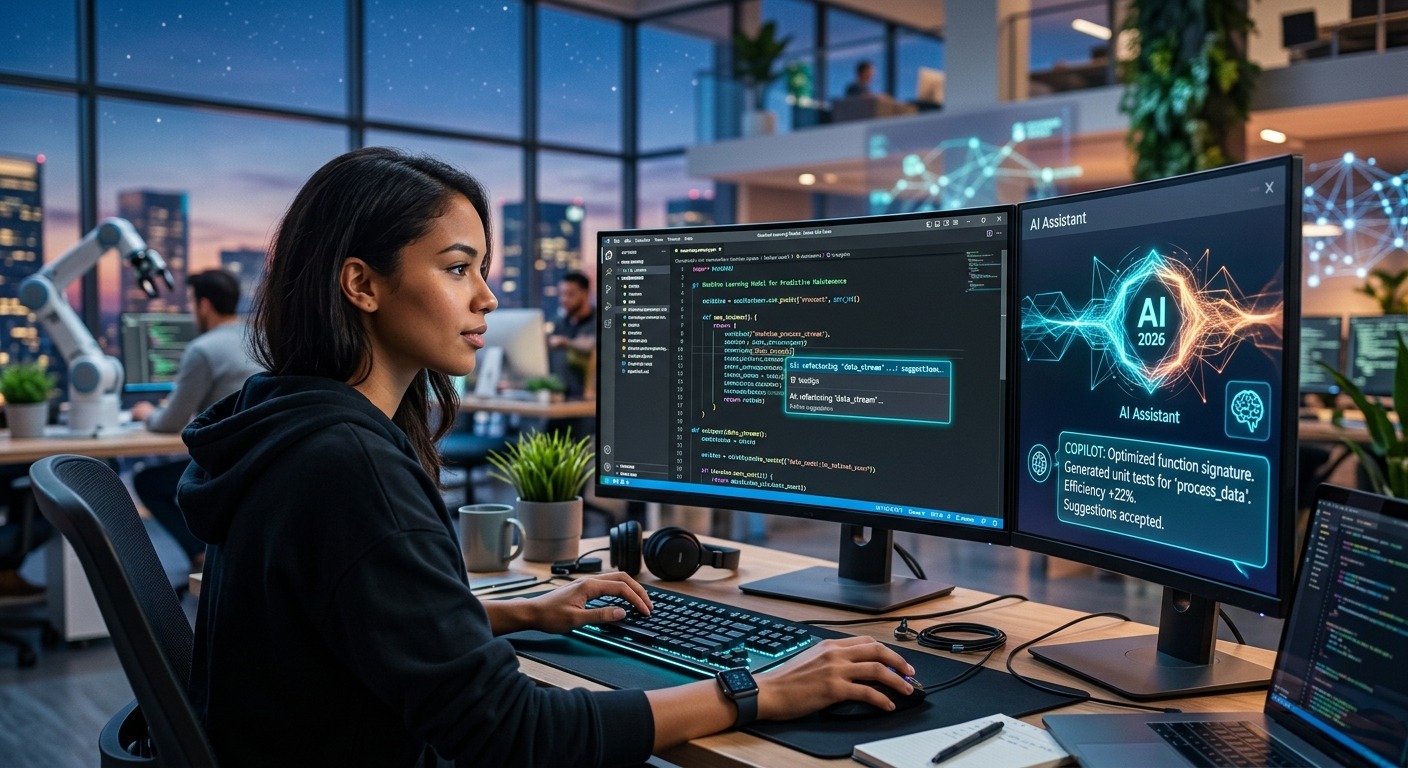
AI code assistants are not new. But the models available in 2026 have crossed a threshold. They no longer just autocomplete a line. They understand your entire repository, your coding style, and your project’s architecture.
The best tool in this category right now is GitHub Copilot X (the 2026 edition). It can refactor entire functions, suggest test cases based on your existing test patterns, and even write documentation that matches your team’s style guide.
Why this matters for your 2026 workflow:
- It reduces boilerplate writing by 70 percent.
- It catches logical errors before you commit.
- It helps junior team members write code that matches senior developers’ patterns.
One senior engineer at a mid sized SaaS company told me that adopting this tool cut their feature delivery time from two weeks to five days. The key is to treat it as a pair programmer, not a magic black box. Review its suggestions. Challenge its assumptions. That is where the real learning happens.
For a deeper look at how these assistants fit into your broader stack, check out our guide on top dev tools every programmer should master in 2026.
Unified Observability: Stop Jumping Between Dashboards
If you are still using separate tools for logs, metrics, and traces, you are wasting time. In 2026, the standard is a unified observability platform that correlates all three signals automatically.
Honeycomb and Grafana Cloud are leading the pack. They let you ask questions like “show me all requests that took longer than 500ms and had a database error” without switching tabs.
Here is a numbered process to set this up for your team:
- Instrument your services with OpenTelemetry. This is the universal standard now.
- Send all telemetry to a single backend (Honeycomb or Grafana Cloud).
- Create three standard dashboards: one for latency, one for error rates, and one for traffic.
- Set up alerts based on SLOs, not static thresholds.
- Run a weekly “observability review” where the team looks at the top three anomalies.
The result is that you stop debugging in the dark. You see the exact path of a failing request from the user’s browser to your database. This alone can save hours per incident.
If you want to learn how to pair this with automated testing, read our piece on how to streamline your code reviews with automated tools in 2026.
Next-Gen Container Orchestration Dashboards
Kubernetes is not going anywhere. But the tools we use to manage it have matured. The days of staring at raw YAML files and kubectl commands are fading.
Lens has evolved into a full featured IDE for clusters. It now includes built in cost tracking, security scanning, and a visual service mesh viewer. You can see which pods are consuming too much memory, which services have high error rates, and which namespaces are costing you money.
Common mistakes teams make with Kubernetes dashboards:
| Mistake | Why It Hurts | Better Approach |
|---|---|---|
| Using raw kubectl for everything | Slow, error prone, no visibility | Use a dashboard like Lens for daily ops |
| Ignoring resource limits | Pods crash under load, bills spike | Set requests and limits for every container |
| No cost visibility | Cloud bills surprise you at month end | Use the built in cost tracking in Lens |
| Skipping security scans | Vulnerable images get deployed | Enable automatic scanning on every push |
The best teams treat their cluster dashboard as a daily check in tool. They look at it first thing in the morning. They spot anomalies before users do.
For a broader view of how containers fit into your 2026 stack, see our ultimate guide to modern dev tools for accelerating software development.
Automated Code Review Bots That Catch Real Issues
Code review is essential. But human reviewers get tired. They miss things. They focus on style instead of logic.
In 2026, automated code review bots have become sophisticated enough to catch real bugs, not just linting errors. Tools like CodeRabbit and Graphite analyze the semantic meaning of your changes. They understand what the code is supposed to do and flag when it does not match.
“The best code review bot I have used caught a race condition that three senior engineers missed. It saved us from a production outage.” – Sarah Chen, Engineering Manager at a fintech startup.
These bots do not replace human review. They handle the boring parts: checking for security vulnerabilities, verifying test coverage, and ensuring consistency with the codebase. That frees up your team to focus on architecture and design decisions.
What to look for in a code review bot:
- It must understand your language and framework.
- It should learn from your team’s past reviews.
- It must integrate with your CI/CD pipeline.
- It should not spam you with false positives.
If you want to see how this fits into a complete CI/CD strategy, check our guide on why integrating a CI/CD pipeline is non-negotiable in 2026.
Local Development Environments That Mirror Production
The classic problem: “It works on my machine.” In 2026, there is no excuse for this. Tools like DevPod and Daytona let you spin up development environments that are identical to production.
These tools use containerized workspaces that include the exact same dependencies, environment variables, and infrastructure as your production servers. No more debugging a bug that only appears in staging.
Here is why this matters for your daily workflow:
- Onboarding new developers takes hours instead of days.
- You can test infrastructure changes locally.
- You never have to say “but it worked on my machine” again.
- Your local environment is reproducible and shareable.
One engineering team I work with reduced their onboarding time from three days to three hours using DevPod. The new hire just cloned a config file, ran one command, and had a full production like environment on their laptop.
For more on how to build the perfect local setup, read our essential dev tools for streamlining your development workflow in 2026.
Putting It All Together for Your 2026 Workflow
The five tools we covered are not just shiny objects. They solve real friction points in your development process. An AI pair programmer reduces boilerplate. Unified observability stops blind debugging. A container dashboard gives you control. Code review bots catch what humans miss. Local environments kill the “works on my machine” problem.
You do not need to adopt all five at once. Pick one that hurts the most right now. Maybe it is observability. Maybe it is local environments. Start there. Use it for two weeks. Measure the difference in your team’s velocity or your personal stress levels.
The goal is not to have the fanciest stack. The goal is to ship better software with less pain. These essential developer tools 2026 will help you do exactly that.
If you are ready to go deeper, check out our 10 must-have dev tools to supercharge your 2026 workflow for an extended list of tools that complement these five.
Your 2026 workflow is waiting. Go build something great.