alexander
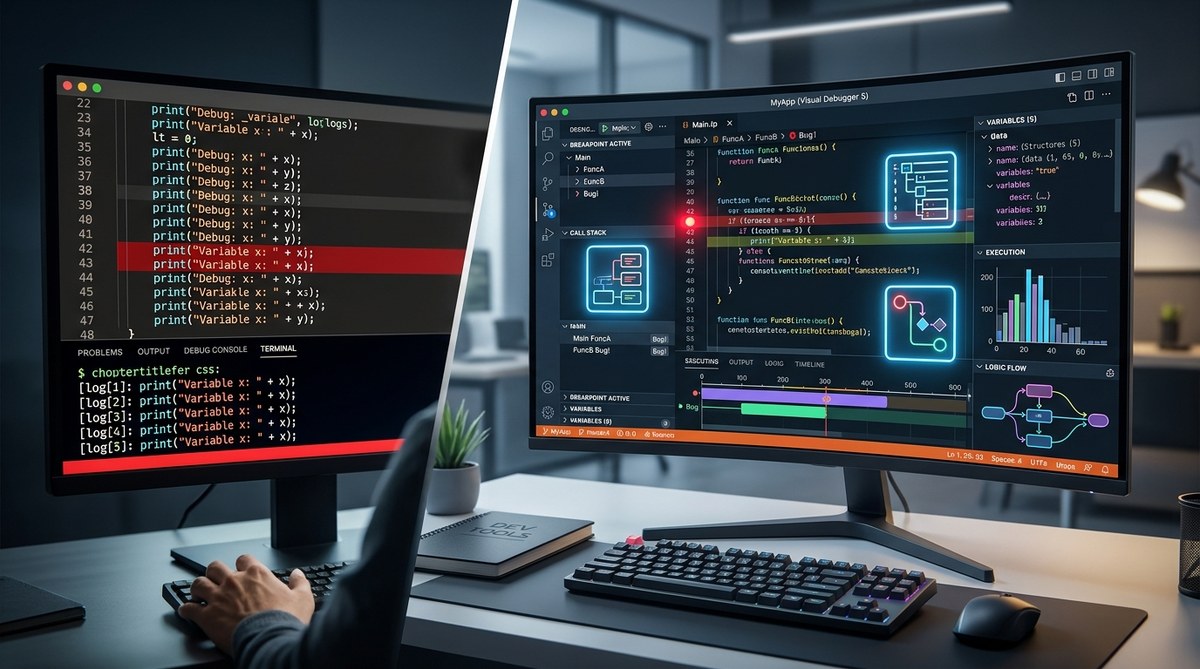
You are staring at a terminal full of console.log output. You added print statements in five different places. You re-ran the test. You scrolled through hundreds of lines of text. The bug is still there. You are not alone. Most developers have been there. The question is: why do we keep doing this to ourselves in 2026?
Print debugging feels fast. It is familiar. You type a line, you run the code, you see the value. But that speed is an illusion. Every print statement you add is code you have to remove later. Every run is a full cycle of the application. Every scroll through log output is time you could spend actually fixing the problem.
Visual debugger tools flip that script. They let you pause execution. They show you the full state of your application at a single moment. They let you step through code line by line without adding a single character to your source files. The comparison between visual debugger tools vs print debugging is not even close once you see what you have been missing.
Print debugging costs you time in edit-run-scroll cycles and leaves clutter in your codebase. Visual debuggers let you inspect variables, evaluate expressions, and trace execution without modifying source files. The five tools covered here replace guesswork with precision. Adopting even one of them will cut your debugging time in half within a week.
What Makes Print Debugging So Hard to Give Up
Print statements are the debugging equivalent of a comfort blanket. You learned them in your first programming class. They work for simple scripts. They require zero setup. You do not need to learn a new interface.
But here is the catch. Print debugging breaks down the moment your application grows beyond a single file. When you have async code, callbacks, or multi-threaded logic, print statements lie to you. They interleave output. They miss timing issues. They cannot show you the call stack.
Think about the last time you debugged a race condition with print statements. You added logs before and after the critical section. You saw the output. You still could not figure out which thread ran first. That is the limit of text-based debugging.
Visual debuggers handle those cases naturally. They freeze time. They show you exactly which thread is executing and what variables look like at that instant.
The Real Cost of Sticking with Print Statements
Let us break down what print debugging actually costs you in a typical workday.
| Activity | Print Debugging | Visual Debugging |
|---|---|---|
| Add debug output | Edit file, add line | Set a breakpoint (one click) |
| Run to see value | Full app restart | Execution pauses automatically |
| Check multiple variables | Add more print lines | Hover over any variable |
| Remove debug code | Manual cleanup after fix | Delete breakpoint (one click) |
| Trace call stack | Impossible without manual logging | Built-in stack panel |
| Inspect complex objects | Serialize to string (lossy) | Tree view of all properties |
The table makes it look obvious. So why do so many developers still default to print? Because the first time you use a visual debugger, it feels slower. You have to learn keyboard shortcuts. You have to understand breakpoints and watch expressions. That learning curve stops people cold.
But the second time you use it, you are already faster. By the tenth time, you wonder how you ever lived without it.
A Practical Process for Switching to Visual Debugging
Here is a numbered process to make the transition painless. Follow these steps with any project you are working on this week.
- Pick one tool from the list below and install it. Do not try to learn three at once. Pick the one that matches your primary language or framework.
- Set a single breakpoint in a function you understand well. Just one. Run the debugger and let it pause.
- Hover over every variable in scope. Look at the call stack panel. Click around the interface for five minutes without trying to fix anything.
- Step through the code line by line using the step-over button. Watch how the variable values change.
- Remove the breakpoint and set a conditional breakpoint instead. For example, pause only when a loop counter equals 50.
- Delete all print statements from that file. You will not need them anymore.
- Repeat this process for one hour each day for a week. By Friday, the muscle memory will be there.
Five Visual Debuggers That Actually Deliver
These are not theoretical tools. These are debuggers that real teams use in production environments right now.
1. Visual Studio Code Built-in Debugger
VS Code ships with a debugger that works out of the box for Python, JavaScript, TypeScript, and many other languages through extensions. The interface is clean. You set breakpoints by clicking the gutter. The debug sidebar shows variables, watch expressions, and the call stack.
What makes this tool stand out is the debug configurations. You can save different launch profiles for testing, production simulation, and specific modules. No more typing the same command over and over.
2. Chrome DevTools
If you build web applications, Chrome DevTools is non-negotiable. The debugger inside DevTools handles client-side JavaScript, server-side Node.js (through the terminal), and even Angular or React applications with proper breakpoint support.
The killer feature here is the inspection of DOM state. You can pause a JavaScript function and immediately see how the DOM looks at that exact moment. Print debugging cannot do that.
3. PyCharm Debugger
Python developers who rely on print statements are leaving money on the table. PyCharm’s debugger is the gold standard for Python. It supports conditional breakpoints, breakpoints that trigger only after a certain number of hits, and even breakpoints that execute a macro and continue running.
The data inspection panel is where PyCharm shines. It renders pandas DataFrames, NumPy arrays, and Django QuerySets as formatted tables. You do not need to serialize them to text.
4. GDB with Visual Frontends
For systems programmers working in C, C++, or Rust, GDB is the backbone. But running GDB from the terminal is not visual. Frontends like gdbgui or the debugger built into VS Code for C++ give you a graphical interface on top of GDB.
You get breakpoints, variable inspection, and stack traces without memorizing obscure GDB commands. It is the same power with a modern interface.
5. IntelliJ Debugger
Java, Kotlin, and Go developers already have IntelliJ open. The debugger in IntelliJ is deeply integrated with the IDE. You can evaluate arbitrary expressions while the code is paused. You can even modify variable values on the fly and let the code continue running with the new values.
This feature alone saves hours. You find a bug, change the variable in the debugger, and verify the fix without recompiling.
“The moment I stopped using print statements and started using a real debugger, my bug-fix rate tripled. Not because I got smarter, but because I could see what the computer was actually doing.” – Senior backend engineer at a major cloud infrastructure company
When Print Debugging Still Makes Sense
Let us be honest. There are situations where print debugging is the right call.
- You are debugging a production issue and cannot attach a debugger to a live server.
- You are working in an embedded environment with no display and limited memory.
- You are debugging a startup script that runs before the debugger can attach.
In those cases, print statements are a survival tool. But those cases are rare. For the other 95 percent of your debugging work, visual tools are faster.
The key is knowing the difference. If you can attach a debugger, do it. If you cannot, use print statements as a last resort, not a first instinct.
How to Evaluate a Debugger for Your Stack
Not every debugger works well with every language. Here is a checklist to use when you are choosing one.
- Does it support conditional breakpoints? Without this, you will waste time hitting the same breakpoint a hundred times.
- Can it inspect complex data structures without serialization? If it shows objects as raw text, it is not better than print.
- Does it integrate with your test runner? The best debuggers let you run a single test in debug mode.
- Can it attach to a running process? This is critical for debugging server applications.
- Does it support remote debugging? If you deploy to containers or cloud instances, you need this.
The One Thing That Makes Visual Debugging Stick
The hardest part of switching from print to visual debugging is not the tool. It is the habit. You have years of muscle memory telling you to type print() or console.log(). Breaking that habit requires conscious effort.
Here is a trick that works. Tape a note to your monitor that says “Breakpoint first.” Every time you reach for a print statement, pause. Ask yourself: can I set a breakpoint here? If the answer is yes, do that instead. After two weeks, the note becomes unnecessary.
Common Mistakes Developers Make When Switching
Even experienced developers stumble when they first adopt visual debuggers. Here are the most common mistakes and how to avoid them.
- Setting too many breakpoints at once. Start with one. Add more only after you understand the flow.
- Forgetting to remove breakpoints. Unlike print statements, breakpoints do not show up in code reviews. Check your breakpoint panel before committing.
- Not using conditional breakpoints. A breakpoint inside a loop that runs 10,000 times is useless. Make it conditional.
- Ignoring the call stack. The call stack tells you how you got to the current line. It is often more valuable than the variable values.
- Skipping watch expressions. Watch expressions let you evaluate complex conditions without adding code. Use them.
Putting It All Together
You have read about the tools. You have seen the comparison. You know the process. The only thing left is to actually try it.
Open your current project. Pick one of the five debuggers listed here. Set one breakpoint. Step through one function. See what happens when you stop guessing and start seeing.
The debate between visual debugger tools vs print debugging is not a debate at all. It is a choice between guessing and knowing. Choose knowing. Your future self will thank you when the next production bug shows up at 5 PM on a Friday.
If you want to round out your toolkit further, take a look at our guide on 9 web app debugging tools worth adding to your developer toolkit in 2026 and learn how to stop debugging in the dark with observability tools. For a broader view of what else can speed up your workflow, check out our list of essential dev tools for streamlining your development workflow in 2026.
The Debugging Habit That Will Change Your Career
The best developers do not debug faster because they are smarter. They debug faster because they use better tools. Print statements are a crutch. Visual debuggers are a seeing aid.
Make the switch this week. Set a single breakpoint. Watch your variables change in real time. Feel the difference between guessing and knowing. Once you do, you will never go back to scrolling through log output again.