alexander
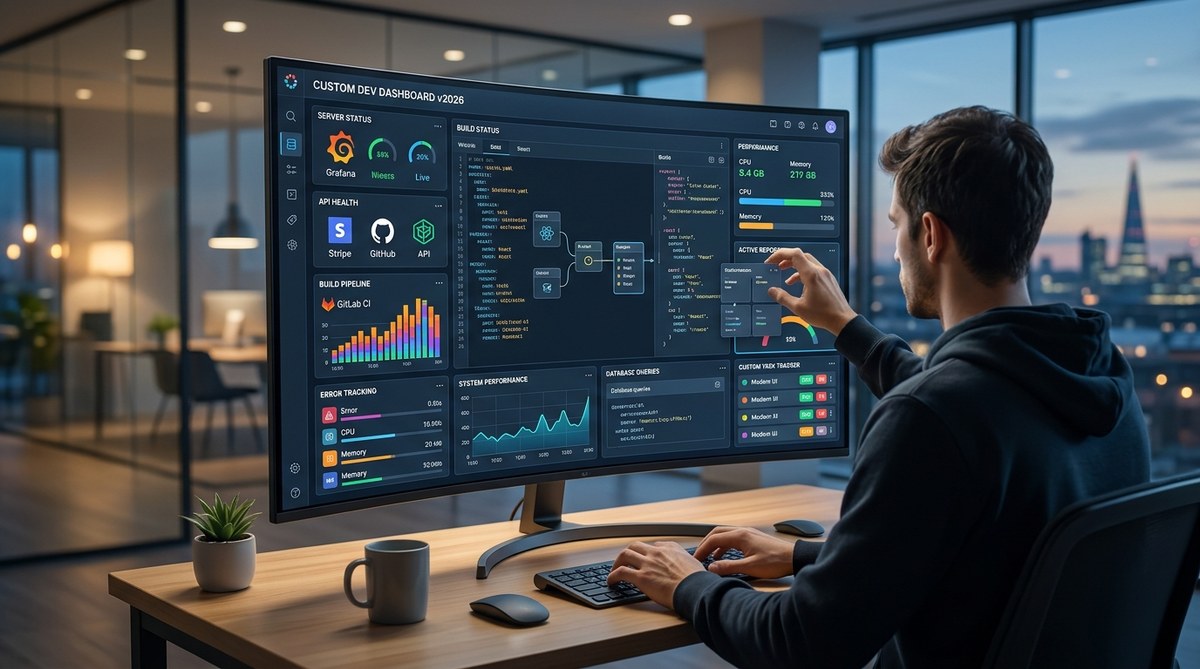
A pre-built dashboard tool can handle the basics. But for a team that needs to see build status, error rates, and deployment logs in one place, a custom developer dashboard is the better move. You get exactly the metrics you care about, without paying for features you will never use. And in 2026, building one is simpler than you think. With modern frameworks, serverless backends, and open source visualization libraries, you can have a working dashboard by the end of this weekend.
Building a custom developer dashboard in 2026 requires picking a lightweight backend (Node.js or Python), a fast frontend framework (React or Vue), and a reliable data pipeline. This guide walks you through the six core steps: choosing your stack, setting up data sources, designing the UI, adding real-time updates, deploying securely, and maintaining the dashboard over time. You will also learn common pitfalls and how to avoid them.
Why Build Your Own Instead of Buying
Off-the-shelf dashboards like Grafana or Datadog are great for generic monitoring. But they often lock you into their data format, pricing model, or limited customization. When you build your own, you control everything.
- No per-seat licensing. You pay for server hosting, not for each developer who opens the page.
- Custom metrics. Pull data from your CI pipeline, your error tracker, your custom APIs, and your database all in one view.
- Full control over the UI. Match your brand, your team’s workflow, and your specific needs.
- No vendor lock-in. Switch hosting providers or change your stack without losing your dashboard.
The tradeoff is maintenance time. But for a team of five or more, the savings on licensing alone often justify the effort. If you are still on the fence, check out our Top Dev Tools Every Programmer Should Master in 2026 for a broader view of the ecosystem.
Step 1: Choose Your Tech Stack
Your stack decision sets the foundation. Here is a breakdown of popular options for 2026.
| Component | Option A (Lightweight) | Option B (Full Featured) | Notes |
|---|---|---|---|
| Backend | Node.js + Express | Python + FastAPI | Node is faster for real-time; Python is better for data processing |
| Frontend | React with Next.js | Vue 3 with Nuxt | React has more community dashboard templates |
| Database | SQLite (single user) | PostgreSQL (team) | SQLite is fine for local; Postgres for multi-user |
| Real-time | Server-Sent Events | WebSockets | SSE is simpler; WebSockets handle bidirectional better |
| Hosting | Fly.io or Railway | AWS or DigitalOcean | Start small, scale when needed |
For most teams, I recommend Node.js with React and PostgreSQL. It is a proven combination with excellent library support. If you want to explore more options, our guide on Choosing the Best Web Hosting Providers for Developers in 2026 can help you pick the right host.
Step 2: Set Up Your Data Sources
A dashboard is useless without data. You need to define what metrics matter to your team.
Common data sources include:
- CI/CD pipelines (GitHub Actions, GitLab CI, Jenkins)
- Error tracking (Sentry, Rollbar, custom logs)
- Application performance (response times, error rates, uptime)
- Deployment status (last deploy time, commit hash, who deployed)
- Custom business metrics (signups, revenue, active users)
For each source, you will write a small connector. A typical connector fetches data from an API, transforms it into a uniform format, and stores it in your database. Here is a rough pattern:
- Poll the external API every 30 seconds.
- Parse the response into a JSON object with consistent keys.
- Insert or upsert into your dashboard database.
- Emit a real-time event so the frontend updates.
This approach keeps your dashboard decoupled from any single vendor. If you change error trackers, you only rewrite one connector.
Step 3: Design the Layout for Scanning
Your team will glance at this dashboard dozens of times a day. It must be scannable in under five seconds.
- Top row: The most critical metrics (deploy status, error rate, response time).
- Middle section: Charts and trends (requests over time, error breakdown by endpoint).
- Bottom section: Detailed logs or tables (recent deployments, recent errors).
Use a grid layout with cards. Each card shows one metric or chart. Keep the color palette minimal: green for healthy, yellow for warning, red for critical. Avoid clutter. A common mistake is trying to show everything on one page. Instead, create tabs or separate views for different teams (backend, frontend, ops).
For layout inspiration, look at Top Collaboration Tools Every Developer Needs for Seamless Teamwork to see how good design supports team efficiency.
Step 4: Add Real-Time Updates
Stale data is worse than no data. Your dashboard should update automatically.
- Server-Sent Events (SSE): The server pushes updates to the browser over a single HTTP connection. Easy to implement, works with most hosting.
- WebSockets: Full duplex communication. Better for dashboards where users also send commands (like triggering a deploy).
- Polling: The frontend asks the server every few seconds. Simple but wasteful. Only use for non-critical data.
I prefer SSE for most dashboards. It is lightweight, works behind most proxies, and does not require a separate library. Here is a minimal example in Node.js:
app.get('/events', (req, res) => {
  res.setHeader('Content-Type', 'text/event-stream');
  setInterval(() => {
    const data = fetchLatestMetrics();
    res.write(`data: ${JSON.stringify(data)}\n\n`);
  }, 5000);
});
On the frontend, you listen with:
const eventSource = new EventSource('/events');
eventSource.onmessage = (event) => {
  updateDashboard(JSON.parse(event.data));
};
This pattern gives you near real-time updates with very little code. For a deeper look at automating your pipeline, read How to Automate Your Entire Development Pipeline with Tools You Already Have.
Step 5: Deploy Securely
Your dashboard contains sensitive data: API keys, error traces, maybe even customer information. Security is not optional.
- Use authentication. At minimum, require a login. OAuth with GitHub or Google works well for internal tools.
- Restrict access by IP. If your team is on a static IP or VPN, whitelist it.
- Never expose raw API keys. Use environment variables on the server.
- Use HTTPS. Let’s Encrypt makes this free and easy.
- Add rate limiting. Prevent a misconfigured client from hammering your data sources.
For deployment, a simple Docker container on a VPS works well. If your team is small, consider a platform like Railway or Fly.io that handles SSL and scaling automatically. Our guide on Top Web Hosting Security Practices Every Developer Should Implement covers this in more detail.
Step 6: Maintain and Iterate
A dashboard is never finished. As your team grows, your metrics will change.
- Add new data sources as you adopt new tools.
- Remove unused cards to keep the UI clean.
- Collect feedback from your team monthly. What do they look at most? What is missing?
- Monitor the dashboard itself. If it goes down, your team loses visibility. Set up a simple uptime check.
A good practice is to treat your dashboard like any other product. Use version control, write tests for your data connectors, and deploy updates through your normal CI pipeline. This keeps the dashboard reliable and maintainable.
“The best dashboard is the one your team actually looks at. Build for their habits, not your assumptions.” — Senior DevOps engineer at a mid-size SaaS company.
Common Mistakes and How to Avoid Them
I have seen teams fall into the same traps. Here is a table of the most common ones.
| Mistake | Why It Hurts | How to Avoid |
|---|---|---|
| Too many metrics | Users ignore the dashboard | Limit to 5-7 key metrics per view |
| No real-time updates | Data is always stale | Use SSE or WebSockets from day one |
| Hardcoded credentials | Security breach waiting to happen | Use environment variables or a secrets manager |
| Single-page for everything | Slow load times, hard to scan | Use tabs or separate views for different teams |
| No mobile support | Can’t check on-call from phone | Use a responsive framework like Tailwind |
Avoiding these will save you from rebuilding the dashboard six months from now. For more on maintaining code quality, see Top 5 Code Quality Metrics Every Developer Should Track in 2026.
Tools and Libraries to Speed Up Development
You do not need to write everything from scratch. These libraries handle the heavy lifting.
- Chart.js or Apache ECharts for interactive charts.
- Tabler or AdminLTE for pre-built dashboard UI components.
- Prisma or Drizzle for database access (type-safe, easy to use).
- Socket.io for WebSocket management (if you need bidirectional).
- Winston or Pino for structured logging from your dashboard itself.
Using these tools, you can go from zero to a working prototype in a single weekend. Our list of Essential Dev Tools for Streamlining Your Development Workflow in 2026 has more recommendations.
A Sample Build Order
If you want a concrete plan, here is a numbered list of steps to follow in order.
- Set up your backend with Node.js and Express. Create a single endpoint that returns mock data.
- Build a React frontend with a grid layout. Display the mock data in cards.
- Replace mock data with real API calls to your CI and error tracker.
- Add a database (PostgreSQL) to store historical data.
- Implement SSE for live updates.
- Add authentication and HTTPS.
- Deploy to a VPS or platform.
- Add a second view for detailed logs.
- Set up a cron job to clean up old data.
- Collect team feedback and iterate.
This order builds value incrementally. You have something usable after step 2, and it gets better from there.
What Your Dashboard Should Look Like After One Weekend
By Sunday evening, you should have:
- A live dashboard showing deploy status and error rate.
- Auto-refreshing every five seconds.
- A login page (even if simple).
- Hosted on a public URL with HTTPS.
- Two to three cards with real data.
That is enough to start showing your team. They will give you feedback, and you can refine from there. Do not aim for perfection on the first pass. Aim for something useful that you can improve.
Your Next Steps
Building a custom developer dashboard in 2026 is a practical investment for any engineering team. It saves money, gives you full control, and adapts to your specific workflow. Start with a small scope, use the tools listed here, and deploy early.
Your team will thank you when they can see the build status without switching between five different tabs. And you will have built something that actually solves your team’s problems, rather than fitting your workflow into someone else’s product.